reports
media
data
software
links
- Figures / Photographs
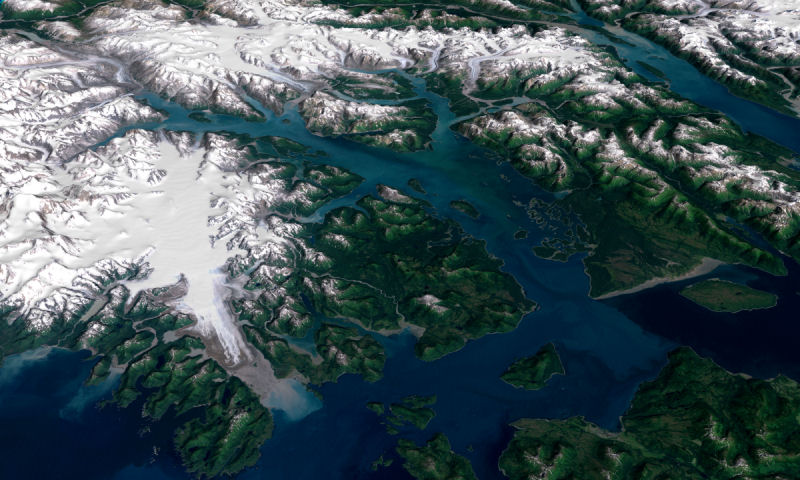
- Glacier Bay satellite (landsat) image (.jpg format). Source: NASA Goddard Space Flight Center.
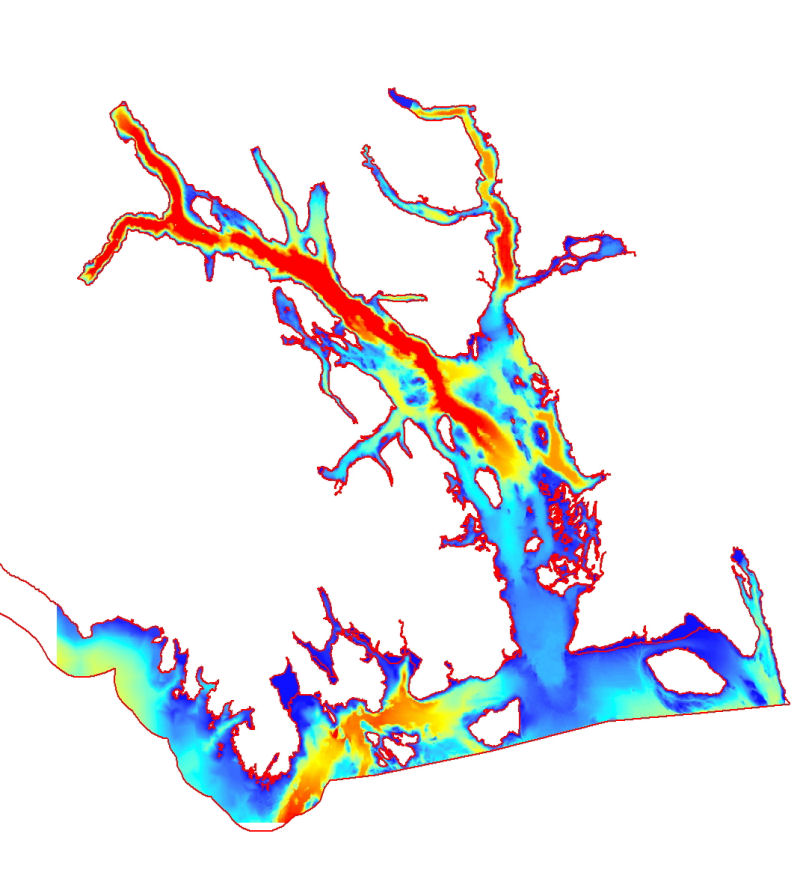
- Bathymetry (.jpg format). Source: Glacier Bay Ecosystem CD.
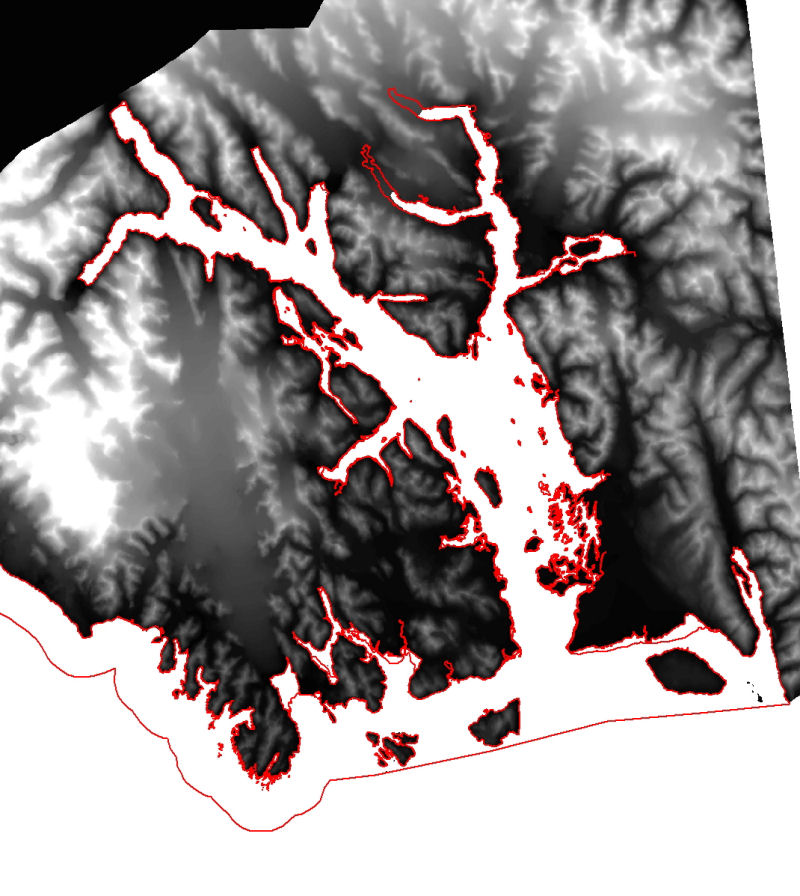
- Topogrpahy (.jpg format). Source: Glacier Bay Ecosystem CD.
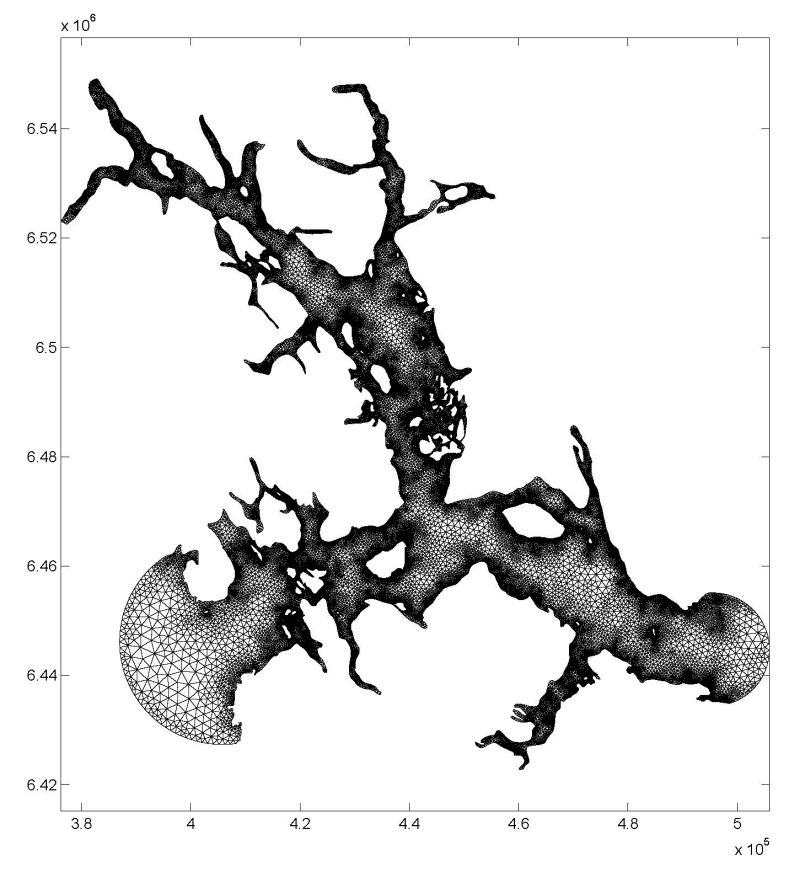
- Finite element mesh of Glacier Bay (.jpg format).
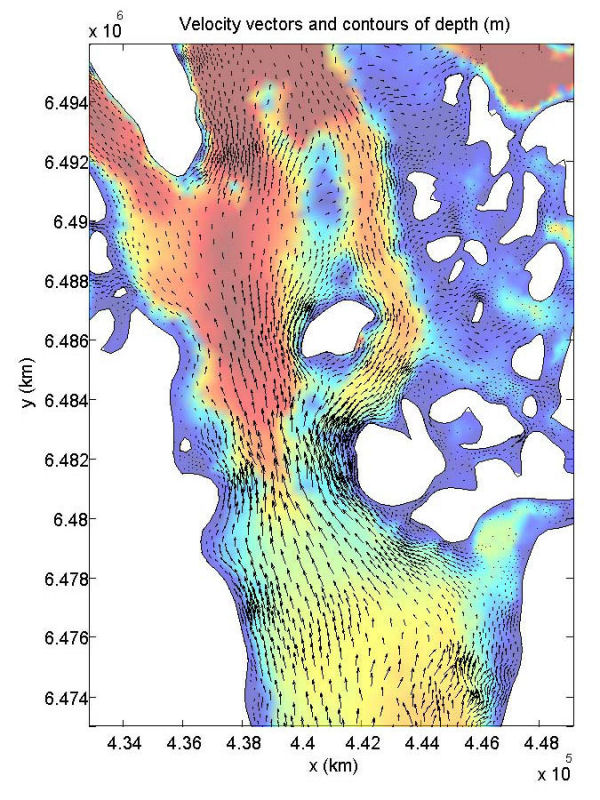
- Velocity vectors with contours of depth (.jpg format).
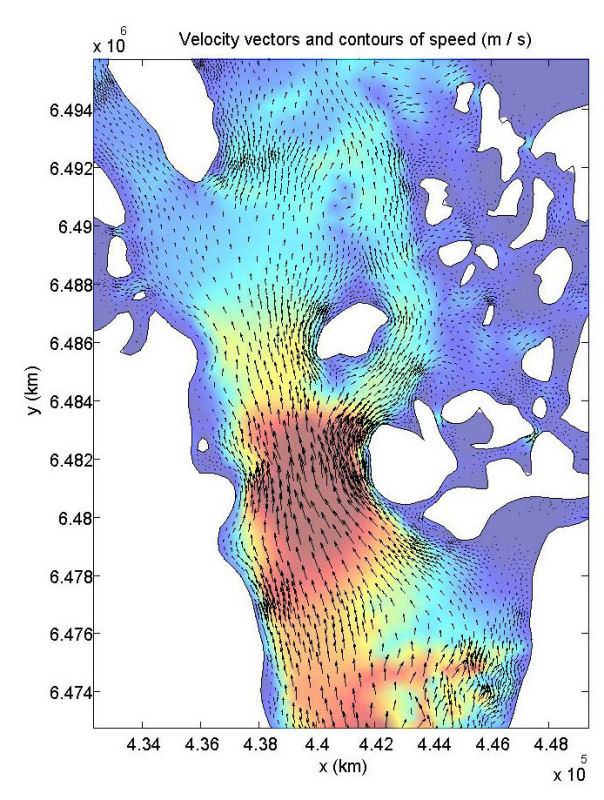
- Velocity vectors with contours of speed (.jpg format).
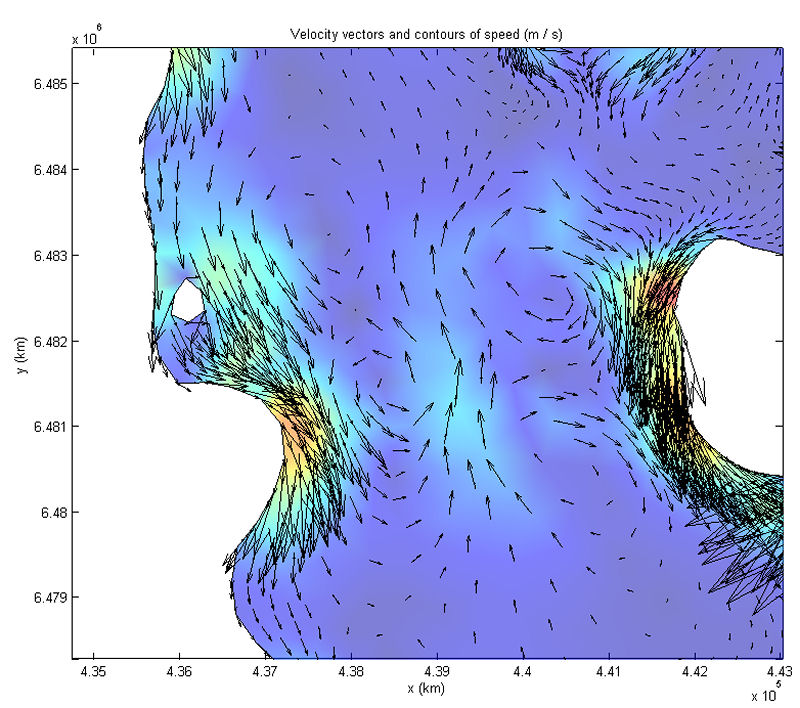
- Evidence of 'eddying' in Sitakaday Narrows area (.jpg format).
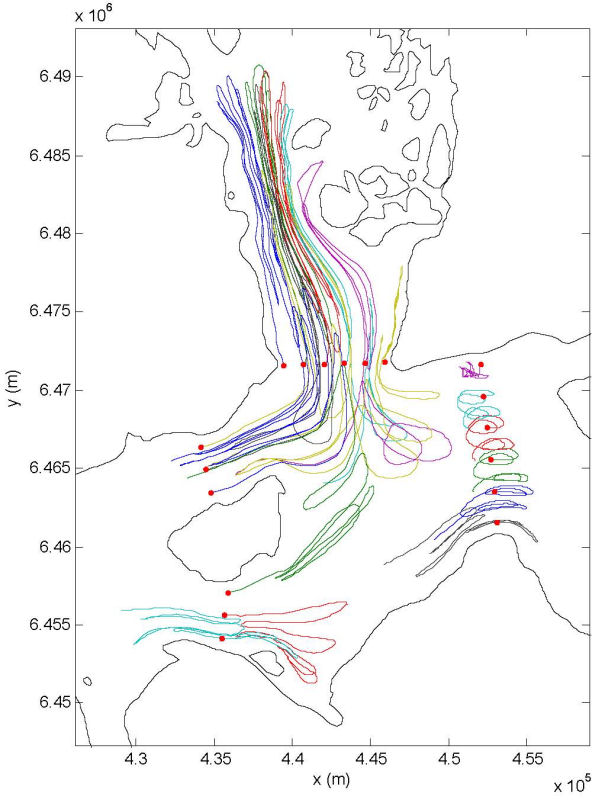
- Drifter tracks (.jpg format; 2 day simulation; flood tide conditions).
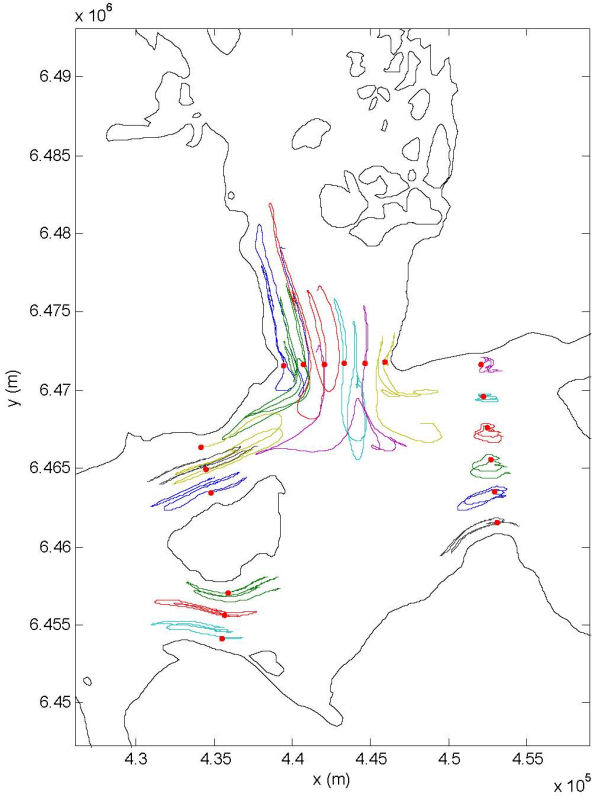
- Drifter tracks (.jpg
format; 2 day simulatioin; neap tide conditions).
- Animations (Project based).
Description
.avi format
.mpeg format
Contours of water surface elevation (1 day simulation). The semi-diurnal tides gives two highs and lows per day, so note the changing colors. 1.2 MB download
3.5 MB download
Velocity vectors and contours of tidal speed (2 day simulation). This run has 'wetting and drying' turned on, so look for shallow regions to dry (turn white) when the tide goes out. 17.5 MB download
10.6 MB download
Zoomed-in view of velocity vectors (Sitakaday Narrows area, 2 day simulation). Look closely to see up to 4 'eddies' being shed when the tide changes direction. Sitakaday is renowned for its swirling tide riffs. 20.1 MB download
10.6 MB download
Drifter tracks (Bay mouth, 2 day simulation). Here, you can watch the path taken by the water. Note the 'barrier' to the east, confirming that Bay waters come mostly from the west. 4.3 MB download
5.6 MB download
Effect of freshwater input (Bay mouth, 2 day simulation). This specifically compares drifter tracks obtained with (red markers) and without (blue markers) freshwater runoff into the Bay included. 4.5 MB download
8.5 MB download
- Animations (External)
- Muir Inlet flyby (Quicktime .mov format). Source: Dorothy K. Hall, Cryospheric Sciences Branch, and the NASA / Goddard Space Flight Center, Scientific Visualization Studio. Other Glacier Bay animations are available online.
- Glacier
Bay Alaska, from the Ground, Air, and Space (.mpg format) - This
excellent (132 MB) and narrated movie uses satellite mapping and
imagery to show changes to Glacier Bay. Source: NASA / Goddard
Space Flight Center, Scientific Visualization Studio.